Learn how to monitor Intune logs with Azure Monitor, SIEM, and Power BI – and where CoreView fits for backup, drift detection, and restore.
This article covers:
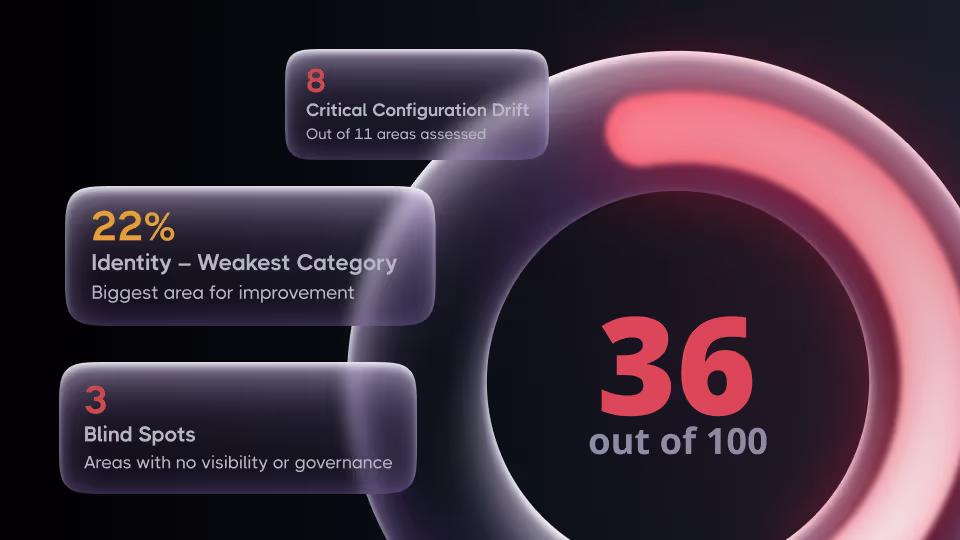
Monitoring Intune logs is essential for securing and governing your mobile device estate in Microsoft 365. By enabling Intune diagnostics, streaming data into Azure Monitor and Log Analytics, and layering in alerts, dashboards, and optional SIEM/Power BI integrations, you get deep visibility into enrollment, compliance, and policy changes. However, log visibility alone doesn’t protect you from misconfigurations or configuration drift. CoreView adds configuration-aware backup, comparison, and restore for supported Intune and M365 objects, helping you recover quickly from mistakes and preserve known-good baselines without replacing Intune as your MDM.
Log visibility alone doesn’t protect you from misconfigurations or configuration drift.
Microsoft Intune allows organizations to provide their employees with access to corporate applications, data, and resources from virtually anywhere, on almost any device, while helping to keep corporate information secure. However, those tasks come with a lot of overhead. Making sure that your Intune applications and devices are running as they should in Microsoft 365 (M365) is one of the key responsibilities of a system administrator.
Monitoring and tracking events in Microsoft Intune is crucial for maintaining the security and efficiency of an organization’s mobile device environment. By effectively using Intune’s built-in logs and integrating them with security monitoring tools, organizations can gain valuable insight into device enrollment, policy changes, app management, and more.
In this guide to Intune logs, we'll explore the right way to monitor and track events and activities in Microsoft Intune. We'll learn about the different tools available for this task, best practices for seamless execution, and ways to automate the management process for minimal hassle for your tech department.
Monitoring and tracking events in Microsoft Intune is crucial for maintaining the security and efficiency of an organization's mobile device environment.
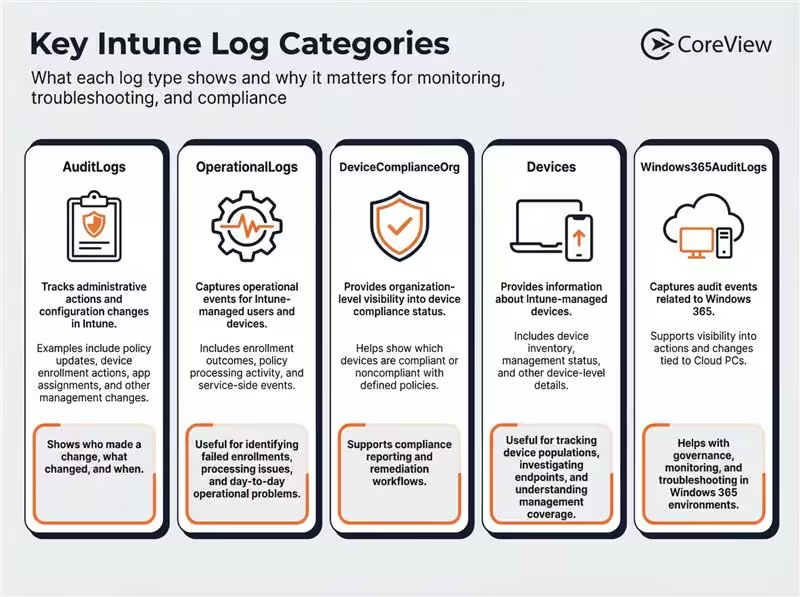
Intune logs are records of events and activities across the Microsoft Intune environment. They play an important role in monitoring, troubleshooting, reporting, and auditing device management operations. Microsoft Intune provides several key log types, each offering a different view of administrative activity, device state, and service events:
These logs can be viewed within the Microsoft Intune admin center and, in many cases, exported or integrated with tools such as Azure Monitor, Log Analytics, or Microsoft Sentinel for deeper analysis, alerting, and visualization. Together, they provide the visibility needed to maintain the security, compliance, and operational health of an organization’s device management environment.
Intune logs are often your earliest and clearest evidence when something starts to go wrong at the device and policy layer. In real incidents, attackers frequently target identity and endpoint controls first – such as, enrolling unmanaged devices, tampering with compliance policies, or pushing malicious or risky apps. If you’re not collecting and reviewing Intune audit and operational logs, those changes can blend into normal administrative noise until they surface as data loss, account compromise, or large-scale downtime.
CoreView’s analysis of real Microsoft 365 breach paths shows the initial foothold is almost always a compromised identity, which is then amplified by over-privileged accounts and misconfigured policies. Intune logs help you spot these issues in practice by recording who changed what and when: new device enrollments from unusual locations, sudden relaxations in compliance rules, failed or unexpected app deployments, or spikes in non-compliant devices. When those logs are streamed into Azure Monitor, SIEM, or analytics tools and paired with Entra ID sign-in and audit data, security teams can correlate suspicious device activity with account behavior, investigate quickly, and contain the blast radius before a localized issue becomes a tenant-wide incident.
Now let's take a look at the step-by-step process needed to monitor and track events using Intune logs.
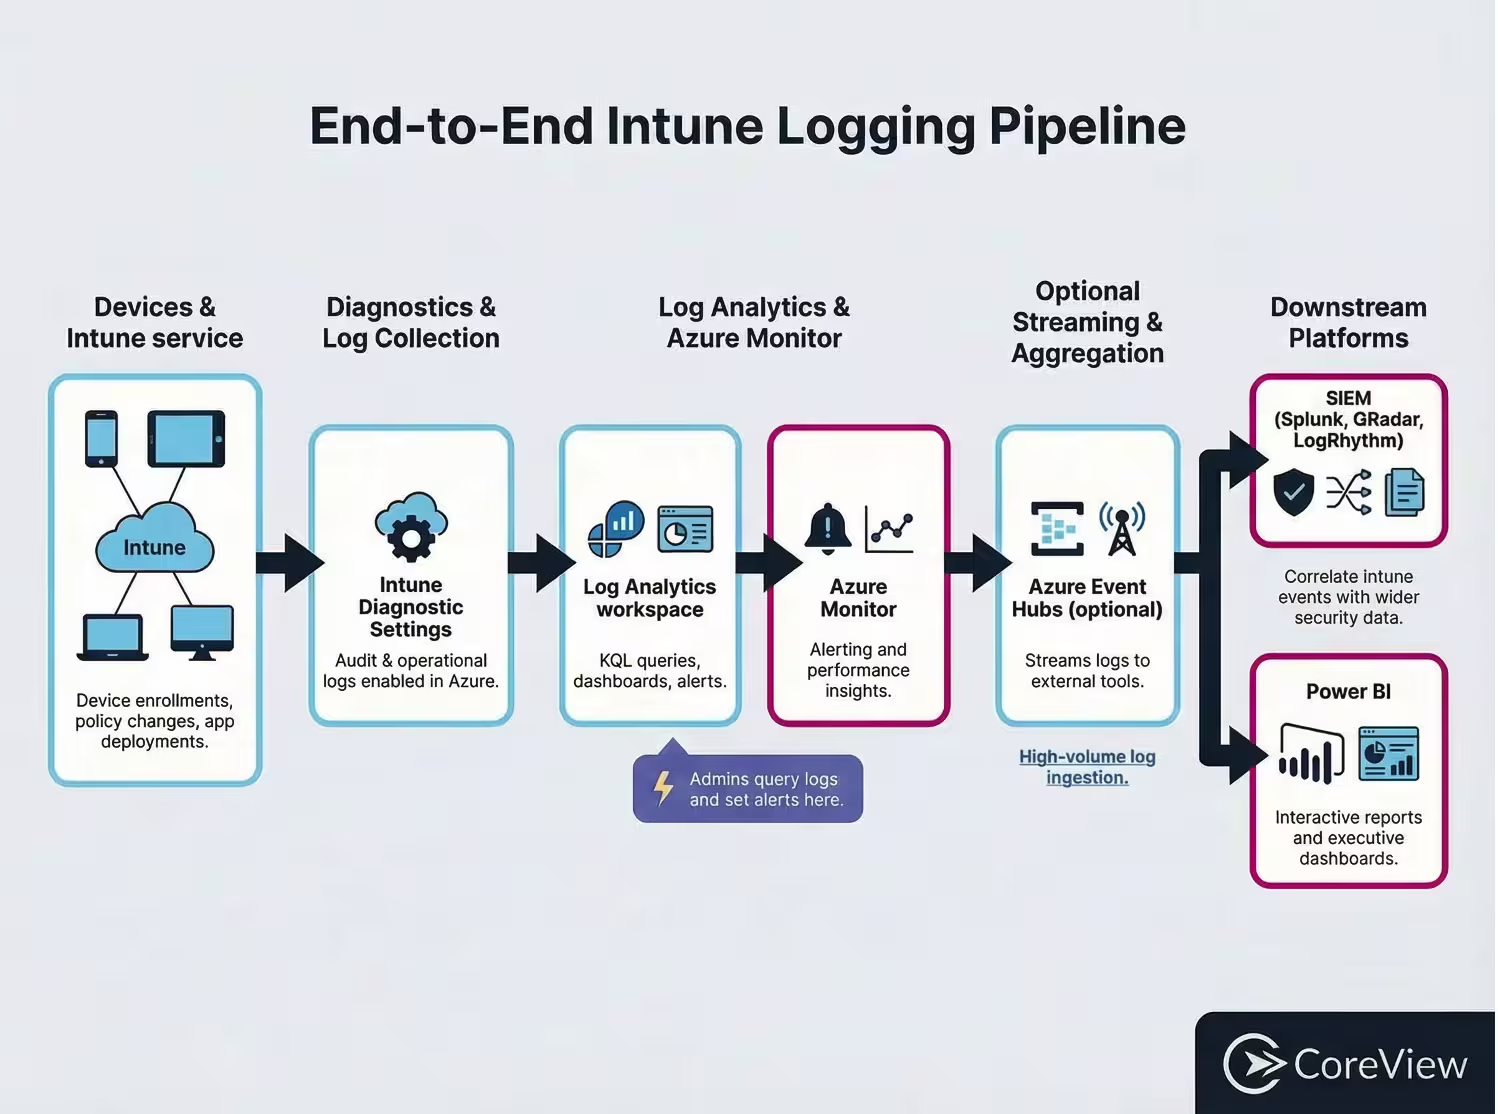
To start tracking and monitoring events in Intune, logs are available by default. If you want to export that data for longer retention, advanced analysis, or integration with tools like SIEMs, you can configure Diagnostic settings in Intune. This feature lets administrators route Intune log data to services such as Azure Storage, Event Hubs, or Log Analytics for further monitoring and analysis.
This data, often referred to as telemetry or diagnostic data, can provide valuable insights into the performance and health of your Intune environment in M365.
Here's how to enable Intune Diagnostics:
Intune app logs can be sent to Azure Monitor. Azure Monitor collects, analyzes, and acts on telemetry from your cloud and on-premises environments. It helps you understand how your applications are performing and proactively identifies issues affecting them and the resources they depend on.
Azure Monitor collects data from various sources, including application logs, operating system logs, and performance data. This data can be used to create comprehensive analytics, allowing you to gain insights, detect anomalies, and set up alerts for specific conditions.
In the log analytics workspace, you can find the logs. Here's how:
You can create queries to filter and analyze the logs. This provides a more detailed and customized view of the Intune logs. For example, you can create a query to show all the successful device enrollments in the past twenty-four hours.
In the log analytics workspace, you can create visualizations for your dashboard. This allows you to visualize the data in a more understandable and digestible format. You can create charts, graphs, and other visualizations based on the queries you have created.
You can set up alerts based on specific conditions in the logs. For example, you can set an alert to notify you when a device fails to enroll. This allows you to proactively address issues as they arise.
Regularly reviewing and analyzing the logs can help you identify trends, spot potential issues, and gain insights into the activities in your Intune environment. This can help you make informed decisions and take appropriate actions to maintain the security and efficiency of your mobile device environment.
Security Information and Event Management (SIEM) tools provide real-time analysis of security alerts generated by applications and network hardware. They are used for threat detection, tracking user activities, and compliance reporting. Here's how you can integrate Intune with SIEM tools:
Power BI is a business analytics tool developed by Microsoft. It provides interactive visualizations and business intelligence capabilities. Here's how you can use Power BI with Intune logs:
CoreView is designed to simplify the administration of M365, and that includes tracking events in Microsoft Intune. It provides a single pane of glass to manage, govern, back up, compare, and restore Intune objects, ensuring best practices are maintained.
Below is how CoreView can help with Intune and overall M365 governance:
CoreView is not an MDM and does not perform device enrollment or direct device management. However, for supported Intune configuration objects (e.g., some device configuration profiles and applications), CoreView Configuration Manager can:
This helps you govern the configuration that Intune uses, even though device enrollment and day-to-day device management remain in the Intune admin center.
CoreView’s value is configuration backup/restore and change visibility, not app installation or packaging.
CoreView provides a unified web interface where IT admins can:
This gives you a consistent governance experience across M365 and supported Intune configuration, without claiming full Intune policy management.
CoreView does not deploy software to devices and does not replace your application packaging tools or Intune’s deployment pipeline. For supported Intune app object types, CoreView can:
CoreView’s value here is configuration backup/restore and change visibility, not app installation or packaging.
CoreView does not provide endpoint malware protection or real-time threat detection on devices. Instead, it focuses on:
CoreView Configuration Manager for M365 helps you:
Intune logging is enabled by default. You can review logs directly in the Intune admin center, and if you want more advanced querying, dashboards, or alerting, you can optionally route diagnostic data to Log Analytics using Reports > Diagnostics settings. From there, you can query tables such as IntuneAuditLogs and IntuneOperationalLogs with KQL to monitor enrollment, compliance, and policy changes.
Prioritize IntuneAuditLogs for admin and policy changes, IntuneOperationalLogs for enrollment and operational failures, and device compliance logs for non-compliant devices. Many teams also correlate these with Entra ID sign-in and audit logs in Azure Monitor or a SIEM to get full user and device activity context.
A: Yes. Microsoft Intune supports routing diagnostic log data to Azure Event Hubs, which can then be consumed by SIEM platforms such as Splunk, QRadar, and Sumo Logic. You can configure this in Intune admin center > Reports > Diagnostics settings, where Intune logs can also be sent to Log Analytics or Azure Storage. Once the data is ingested into your SIEM, you can use it for correlation, monitoring, alerting, and investigation alongside other security telemetry.
Export relevant Intune log data from Log Analytics (or via scheduled exports) to a format like CSV or connect via APIs, then import into Power BI. From there, you can build visual reports and dashboards for device enrollment trends, compliance posture, failure hotspots, and policy impact, and share them across IT and security teams.
Intune retains policy and app objects but doesn’t provide full configuration versioning, baselines, or point-in-time rollback across your tenant. To protect against misconfigurations and drift, many organizations add tools like CoreView that can back up, compare, and restore supported Intune and broader M365 configuration objects.
CoreView doesn’t replace Intune as your MDM or app deployment engine. Instead, it discovers and inventories supported Intune configuration and app objects, backs them up for point-in-time snapshots, compares versions to highlight drift, and restores or reapplies known-good configurations where supported – alongside unified governance for Exchange, SharePoint, Teams, Entra ID, and more.